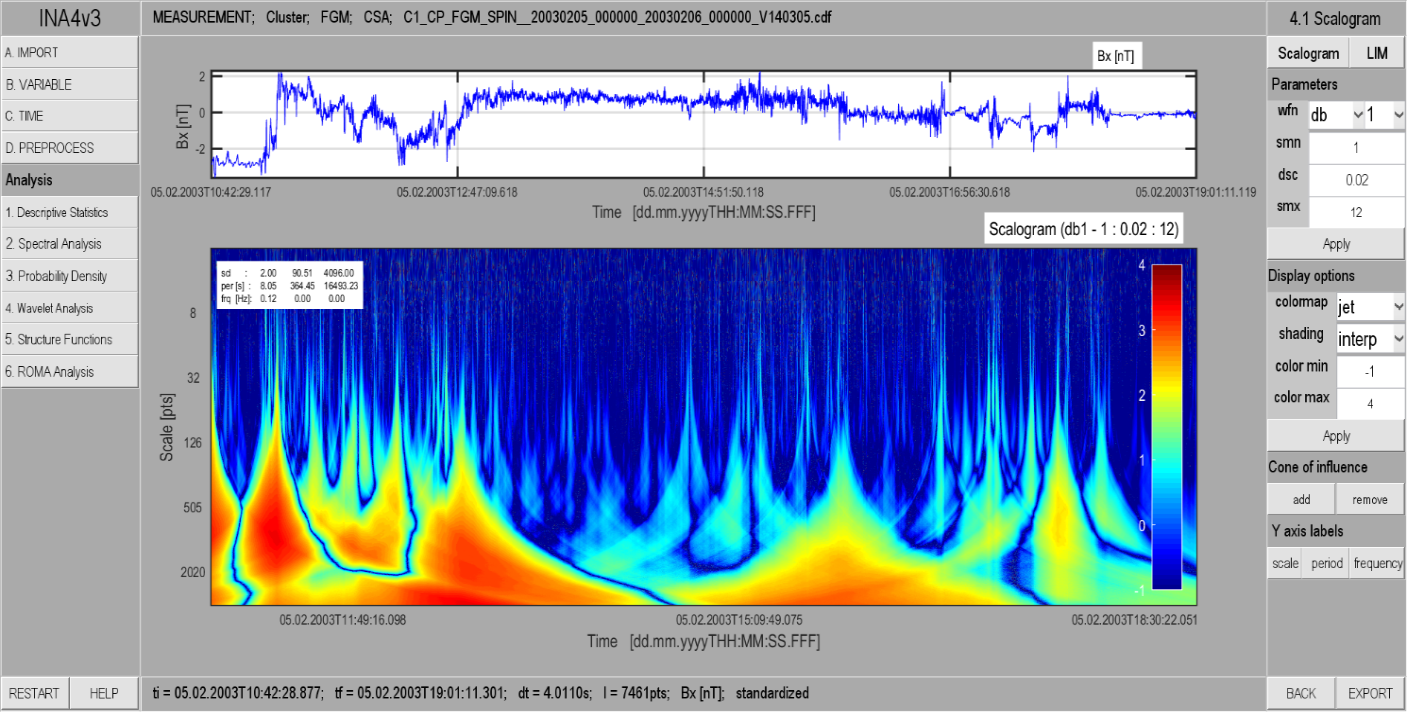
A tutorial that explains how to use and adapt the wavelet module in INA is included here: INA_Tutorial6_Wavelet_Analysis_v2.pdf
The wavelet scalogram is implemented as a 3D color representation of the wavelet coefficients, where the horizontal axis represents the time t, the vertical axis represents the scale a, and the color scale (z axis) represents the logarithm of the squared modulus of the wavelet coefficients. Various families of wavelets can be used. The Local Intermittency Measure (LIM) is defined as a normalized scalogram that emphasizes the regions of "stronger" wavelets coefficients compared to the background. In turbulence LIM can be used to identify the sources of intermittency, like, e.g., sites of bursts of energy dissipation or various types of shears (magnetic, velocity). A screenshot of the wavelet module applied on Cluster magnetic field data is included below together with a tutorial on this INA functionality.


